Financial Capital Strategy

Aim to Achieve VISION 2030 stage2 by Implementing Investment and Financial Strategies That Focus on the Cost of Capital and the Stock Price
Results of the VISION 2030 stage1 Financial Strategies
In FY2024, the final fiscal year of VISION 2030 stage1 (V30-1), Gunze reported that sales and profits had increased compared to the previous fiscal year.
Net sales stood at ¥137.1 billion, up 3.2% year on year.
Operating profit came to ¥7.9 billion, up ¥1.1 billion.
Ordinary profit totaled ¥8.1 billion, up ¥1.4 billion. Net profit was ¥6.2 billion, up ¥1.1 billion.
Net sales increased primarily due to the recovery of domestic demand in the field of plastic films, the growth of sales of products for office automation equipment and
semiconductor-related products in the engineering plastics field, and the launch of new products and increased sales in China in the medical business.
Operating profit rose chiefly due to higher profits in the functional solutions and medical businesses, as well as improved profits in the sports club field as a result
of structural reform, although profit in the apparel business declined due to decreased sales and increased costs, which included the effects of the weak yen.
However, Gunze did not meet its target operating profit of ¥10.0 billion for V30-1, and it also fell short of its initial fiscal year forecast, ¥9.0 billion.
Return on equity (ROE) stood at 5.3%, increasing 0.9 percentage points from the previous fiscal year, but falling short of the target (6.3%).
FY2025 Forecasts
Gunze forecasts that net sales and operating profit will rise to ¥140.0 billion (up 2.1% year on year) and ¥8.5 billion (an increase of ¥0.5 billion) in FY2025,
respectively, chiefly due to the growth of the functional solutions and medical businesses. However, net profit is forecast to decrease to ¥2.8 billion (down ¥3.4
billion) due to anticipated extraordinary losses related to structural reforms.
In the functional solutions business, net sales are forecast to decline 3.3% year on year, primarily due to Gunze’s exit from the electronic components field.
However, operating profit is projected to rise ¥0.8 billion compared to the previous year.
This expected growth is largely attributed to the establishment of a resource recycling model centered around the Circular Factory™ (a resource recycling facility) in
the field of plastics, the introduction of new environmentally friendly products to the market, and the expansion of the Konan Plant in the engineering plastics
business to meet the increasing demand in the medical and semiconductor markets.
In the medical business, net sales are projected to grow 20.5% year on year, driven by the global sales of artificial dermis, Bioabsorbable reinforcement felts and bone
fixation devices and an increase in sales of Absorbable adhesion barrier sheet in the domestic market.
Operating profit is expected to rise slightly, ¥70 million year on year, reflecting depreciation expenses related to new plants.
In the apparel business, FY2025 and FY2026 are designated as a period for structural reform.
As the business will be focused on implementing revitalization initiatives, net sales are forecast to increase only slightly, and operating profit is projected to
decline ¥0.3 billion.
In the lifestyle creations business, net sales are expected to increase 10% year on year, and operating profit is projected to rise ¥0.2 billion, primarily due to the
expanding school business in the sports club field.
Net profit is projected to decrease.
We will implement the financial strategies described below to make FY2025 a year for establishing the foundation needed to achieve the targets set in VISION 2030 stage2
(V30-2).
GVA / ROIC
Gunze Value Added (GVA; net operating profit after tax + dividend income - invested capital × WACC) in FY2024 was negative ¥0.9 billion.
This is an improvement of ¥0.7 billion compared to the previous fiscal year, but it falls ¥0.7 billion short of the target.
Gunze’s goal was to move GVA into positive territory during the V30-1 period, but it was unable to achieve this goal.
However, the effect of the Group-wide efforts to convert assets into higher-yield assets and enhance return on invested capital (ROIC) are increasingly evident.
The Group’s total assets increased slightly, ¥1.5 billion greater than in the benchmark FY2021.
While the Group reformed its structure to reduce low-profit assets, including the sale of cross-shareholdings and the discontinuation of unprofitable businesses, the
total assets of the growth-driving medical business and the functional solutions business, which is contributing to the increase of profits, increased ¥13.8 billion.
Consequently, the assets in these two businesses rose to 45% of the Group’s total assets.
The ROIC for the Group as a whole in FY2024 was 4.3%, a 1.6-percentage-point improvement over FY2021.
Looking at ROIC by segment, the ROIC of the functional solutions business remained in the 10% range.
While invested capital increased significantly due to investments in the construction of the Circular Factory in the plastics field and the expansion of plants in the
engineering plastics field, operating profit also increased.
The ROIC of the medical business in FY2024 was in the 14% range due to active investments, primarily in the expansion of plants.
ROIC is expected to rise to 25% in FY2027.
The ROIC of the apparel business in FY2024 was in the 1% range.
It is planned to increase the business’s ROIC to the 5% range in FY2027 following the structural reforms planned in FY2025 and FY2026.
Lastly, the ROIC of the lifestyle creations business improved to 3.8%, chiefly due to the structural reform of the sports club field.
In the V30-2 period, the continued structural reform is planned, including the reduction of low-yield and low-growth assets, to enhance the Group’s returns on capital.
Change in ROIC, Operating Profit, and Total Assets

VISION 2030 stage2 Financial Strategies
The Company’s stock price increased approximately 40% during the V30-1 period, but the PBR remains below 1. It is still below the Company’s liquidation value. We
believe the primary reason for this is that, despite our steady progress in increasing profits and improving asset efficiency, our return on equity (ROE) has fallen
short of shareholders and investors’ expectations regarding the cost of equity capital.
The Company has estimated the cost of equity capital for the V30-2 period to be between 7.2% to 7.8%. This estimate is based on the capital asset pricing model (CAPM)
and investors' expectations of ROE, which the Company has determined through communication with them.
The Company has established a consolidated ROE target of 8% or higher based on this estimate.
To meet this ROE target, the Company will enhance its management using GVA and ROIC.
For example, the Company enhanced its management using a GVA and ROIC tree during the development of V30-2.
Through the on-site KPI management using this method, the Company will monitor the progress of plans, identify issues, develop and implement effective measures to
address the issues, and achieve capital profitability that exceeds the divisional WACC and target ROIC.
V30-2 Financial Strategy Summary
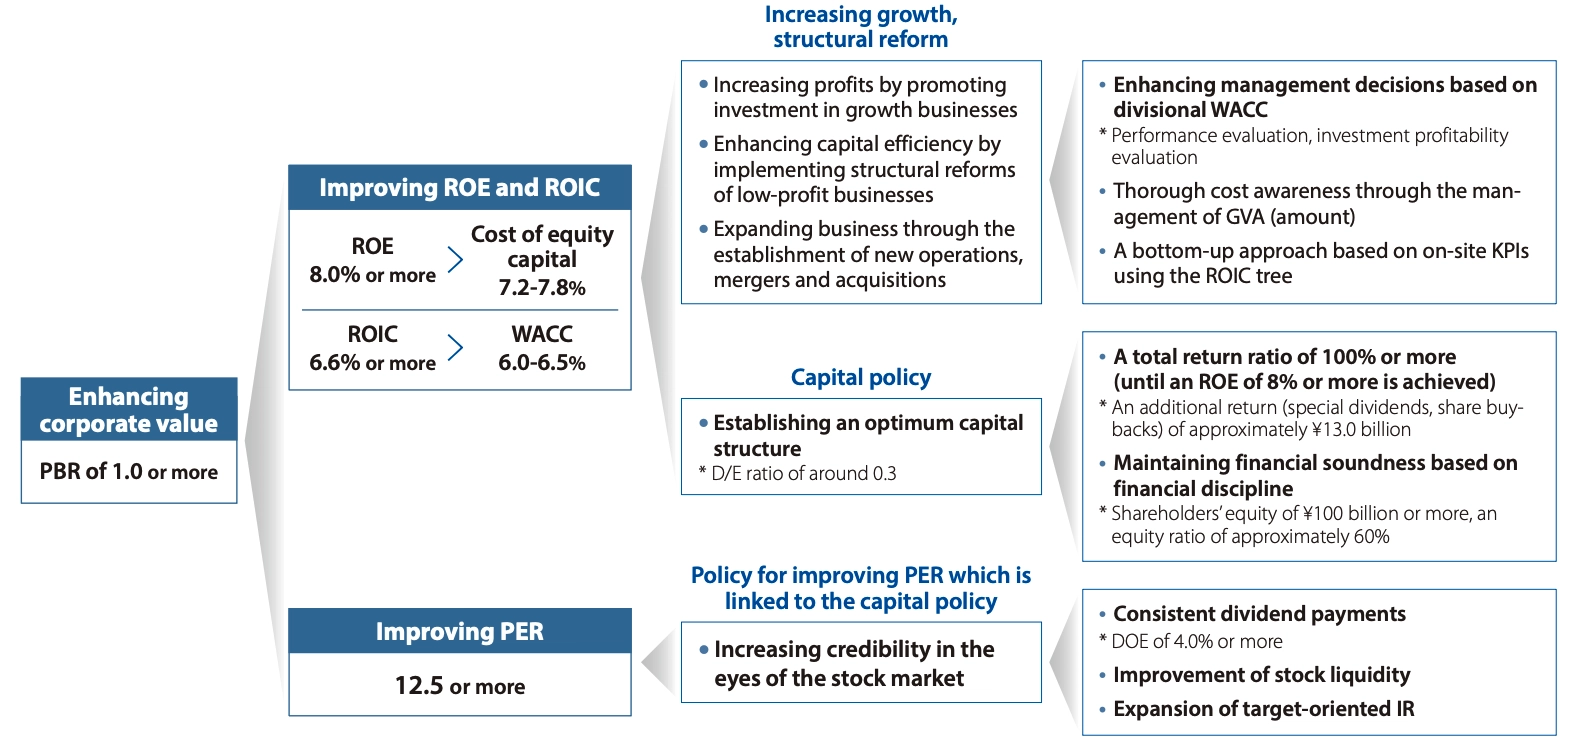
Establishing an Optimum Capital Structure
Gunze believes that it must optimize its capital structure to increase its consolidated return on equity.
The Company has decided to develop a capital structure that emphasizes maximizing returns on capital and ensuring financial soundness (maintaining external ratings).
Gunze emphasizes maintaining its external ratings because it is considering raising substantial capital in Japan, including refinancing, in and after FY2025.
In a world with interest rates, we believe that maintaining external ratings is crucial to keeping funding costs low.
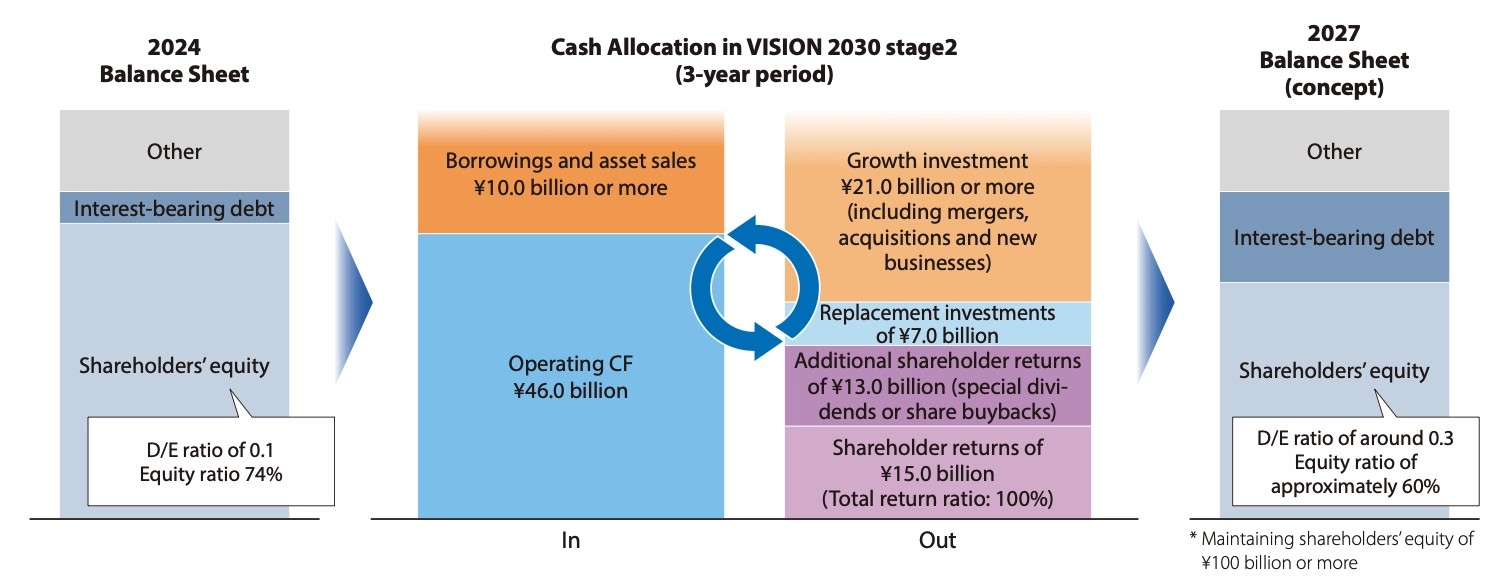
Based on financial simulations, Gunze has determined that its optimal capital structure for V30-2 is shareholders’ equity of ¥100 billion or more and an equity ratio of
approximately 60%.
We estimate that the debt-equity ratio for this capital structure will be approximately 0.3, and the WACC will be 6%-6.5%. We expect that by achieving the profit
targets of V30-2, our ROIC spread will be positive.
Gunze believes that any capital above this level should be returned to shareholders and investors, and it has decided to aim for a total return ratio exceeding 100%.
Currently, the Company estimates that it will return approximately ¥28 billion to shareholders during the V30-2 period, funded by net cash from operating activities.
We expect that replacement investments will be kept within net cash from operating activities and plan to increase financial leverage by raising funds for growth
investments from external sources.
Cash Allocation in V30-2 to Establish an Optimal Capital Structure
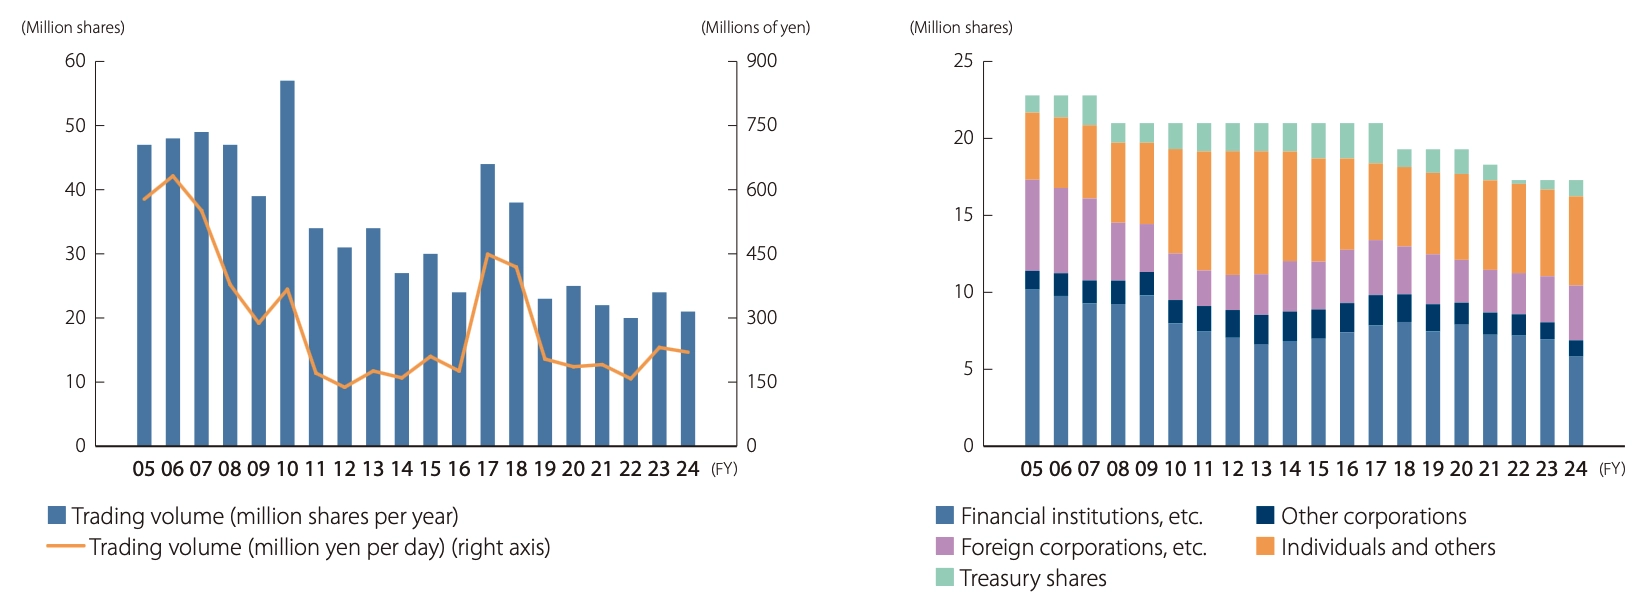
Improving Stock Liquidity
To enhance management’s focus on the stock price, Gunze analyzed its stock performance over the past 20 years during the development of V30-2.
The average daily trading volume of our shares has declined in recent years to around 50% of what it was during the peak years from FY2005 to FY2007.
We believe that institutional investors are now less likely to trade the stock.
We analyzed the factors contributing to the decline in liquidity and identified the following trends: (1) the number of shares in circulation has decreased due to share
buybacks and cancellations; (2) there has been a noticeable decline in new individual shareholders; and (3) the current shareholders evidently tend to hold their shares
for longer periods.
We believe that even if return on capital increases, the stock price may not rise as expected unless the liquidity of the stock improves.
Gunze has thus identified increasing the liquidity of its stock as a priority in V30-2 and considered specific measures to improve this issue.
First, the Company aims to stimulate trading, focusing on individual investors.
We executed a stock split on April 1, 2025, and revised our shareholder benefits program.
In response to feedback from shareholders and investors and social trends, we have changed our dividend standard, increasing the dividend on equity ratio (DOE) from
2.2% or more to 4.0% or more. In V30-2, the Company plans to achieve a total return ratio of 100% or more.
In consideration of the liquidity of its stock, Gunze aims to increase the percentage of its shareholder returns that take the form of dividends.
When the trading volume increases and stabilizes, we will create new opportunities to engage in dialogue with investors, such as small meetings and information
sessions, to encourage domestic and international institutional investors to trade the Company’s stock.
Through these initiatives, Gunze aims to enhance its return on capital and PER, ensuring that its PBR consistently exceeds 1 as quickly as possible.
Change in the Trading Volume of the Company’s Stock, and in the Company’s Shareholder Composition
Treasury Stock, and Dividend per Share, Dividend Payout Ratio
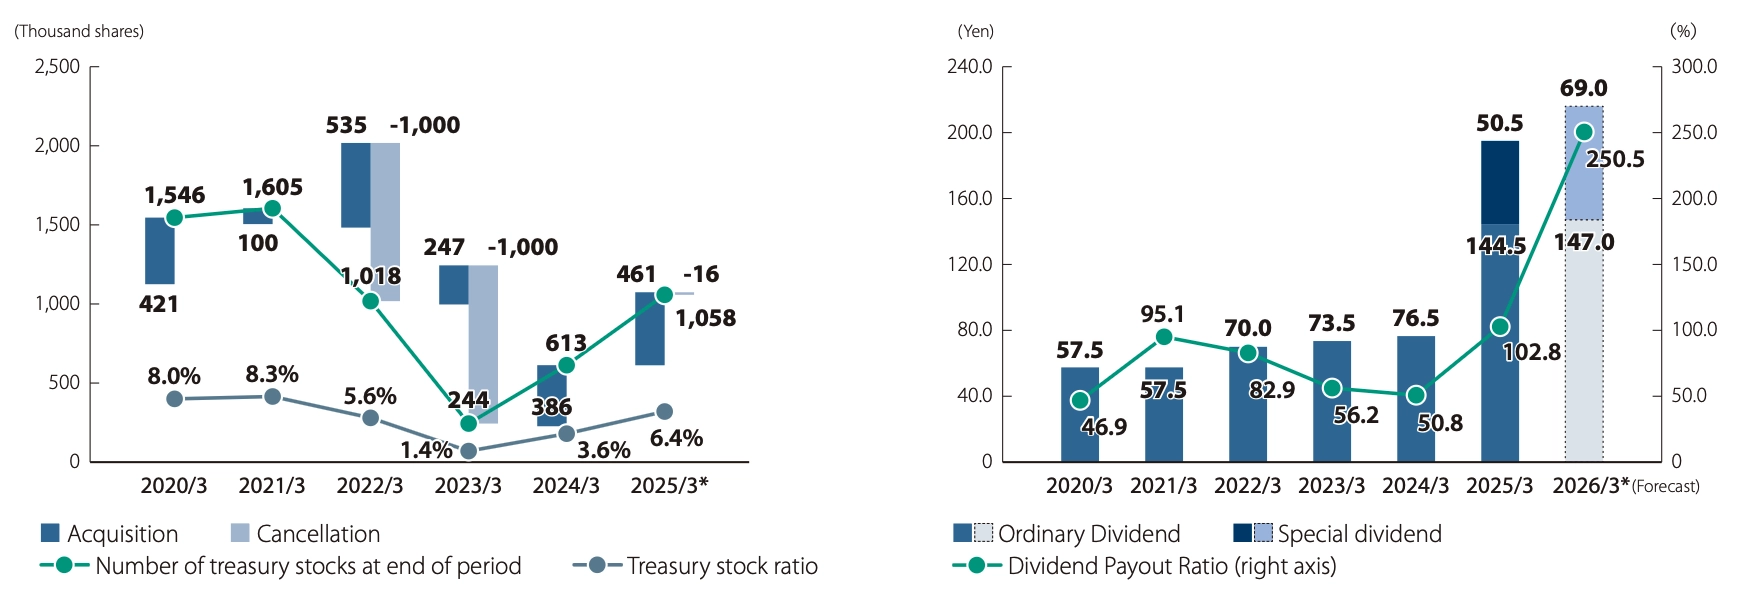 * The figures in the Change in Dividend per Share, Dividend Payout Ratio graph were calculated assuming the stock split had already been executed before the year in
question.
* The figures in the Change in Dividend per Share, Dividend Payout Ratio graph were calculated assuming the stock split had already been executed before the year in
question.(The Company conducted a two-for-one stock split on April 1, 2025.) The figures for the other graphs are calculated based on the number of shares before the stock split.